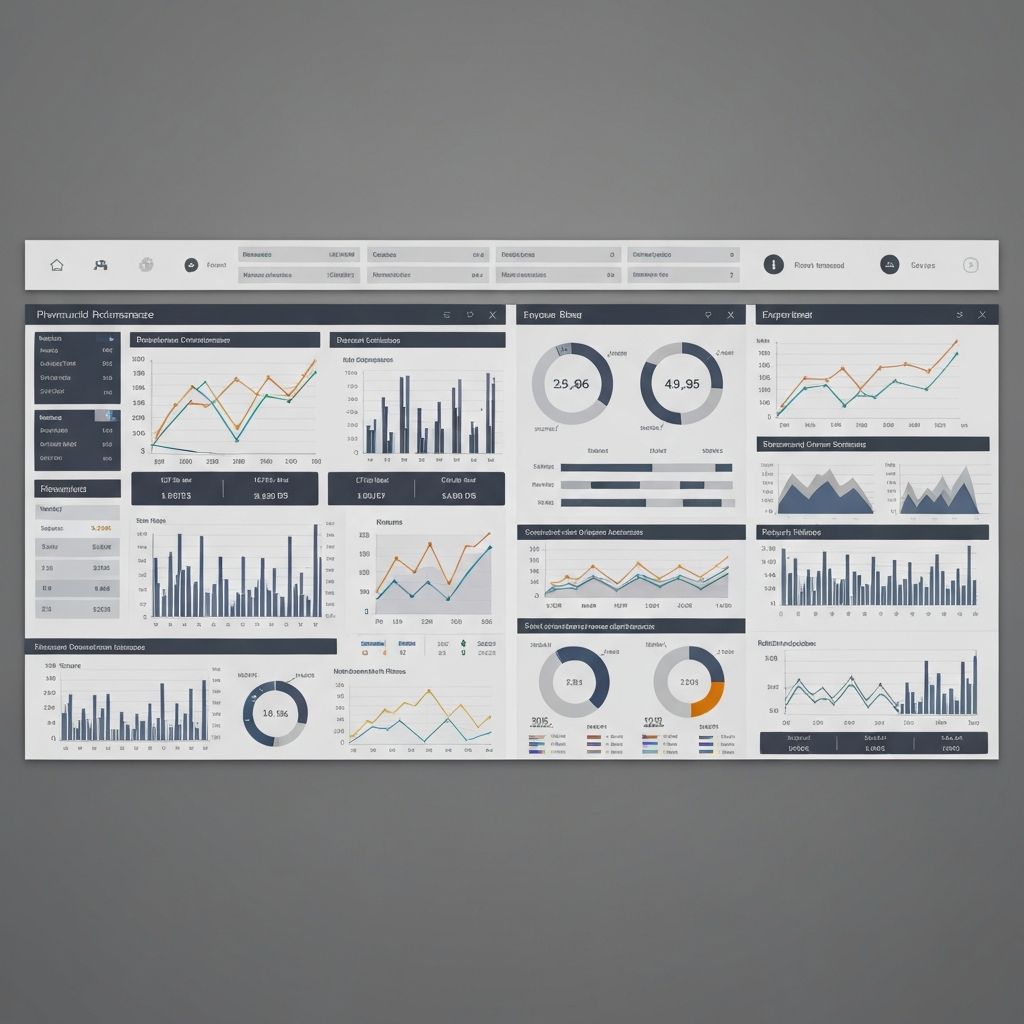
Financial Dashboard
Enterprise dashboard for financial advisors with real-time data visualization and reporting
Impact
40% faster decision making
Timeline
10 months
Role
Lead UX Designer
The Challenge
Financial advisors were juggling multiple systems to access client data, market information, and compliance reports. This fragmented experience led to inefficiency, errors, and difficulty in providing timely advice to clients.
The Solution
Created a unified dashboard that aggregates data from multiple sources into a single, intuitive interface. Designed custom data visualizations that highlight key insights and trends. Implemented role-based access and customizable views for different user needs.
Design Process
Discovery & Analysis
- •Contextual inquiry
- •Data audit
- •Workflow analysis
- •Compliance requirements review
Design & Validation
- •Information architecture
- •Data visualization design
- •Interactive prototypes
- •Expert reviews
Implementation & Training
- •Design system
- •Developer collaboration
- •User training program
- •Feedback loops
Key Results
40%
Faster decision making
3x
Increase in productivity
95%
User adoption rate
50%
Reduction in training time
Project Info
Client
Wealth Management Firm
Team
5 designers, 2 researchers, 10 developers
Duration
10 months
"This dashboard has revolutionized how our advisors work. They now have all the information they need at their fingertips, enabling faster and better client service."
Jennifer Rodriguez
Chief Technology Officer